Turn Node.js data exhaust into decisive insights
We connect product, revenue, and operations data with real-time dashboards built on Node.js pipelines.
Analytics stacks engineered for operators
We ingest data from SaaS tools, product events, and financial systems, then expose accessible metrics for every stakeholder.
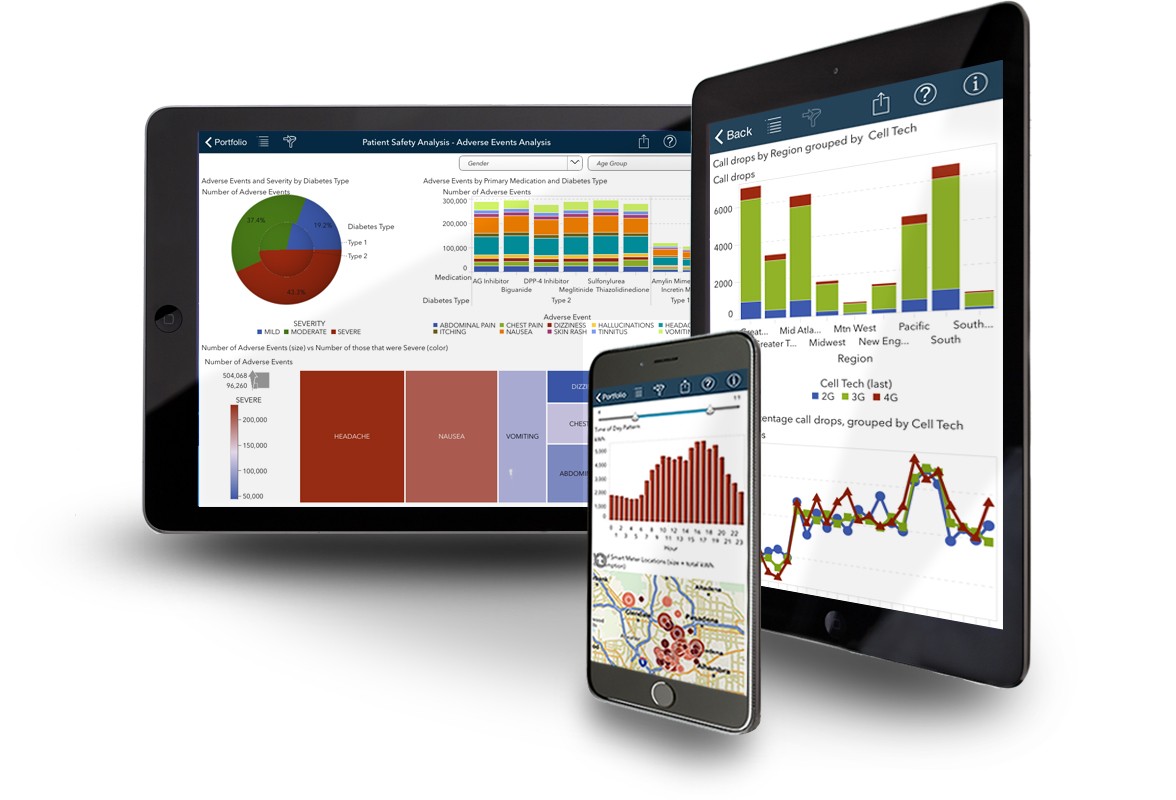
Decision-quality telemetry
Analytics should be actionable, automated, and always in sync with your product roadmap.
Analytics solution tracks
Pick the data experience your teams need, from product telemetry to board-level reporting.
Product Analytics Foundations
Executive Dashboards
Operational Intelligence
Analytics that fuel action, not just dashboards
We measure success by decisions made faster, campaigns optimized, and customers retained.
Revenue-linked metrics
Every dashboard traces back to acquisition, activation, retention, or expansion goals.
Composable data products
Shared semantic layers and APIs let downstream teams build apps without reinventing ETL.
Data trust built-in
Automated validation, lineage tracking, and documentation keep stakeholders confident.
Developer-friendly tooling
dbt, Temporal, and Node.js microservices orchestrate pipelines that engineers enjoy maintaining.
Analytics & Reporting FAQ
Answers to the most common questions executives and RevOps teams ask before green-lighting an analytics initiative.
How quickly can we expect to see usable dashboards?
Most clients see their first executive-ready dashboards within 4-6 weeks. We begin by modeling the highest-impact KPIs, ship a thin slice of the experience to validate data trust, then expand coverage incrementally while instrumentation and governance mature in parallel.
What tools and warehouses do you support?
We routinely build on Snowflake, BigQuery, Redshift, Databricks, Postgres, and ClickHouse, and expose insights through Looker, Power BI, Tableau, Metabase, or custom Node.js/React embeds. Our ingestion services integrate with SaaS APIs, product telemetry, and event buses, so we can meet you where your data already lives.
How do you ensure data accuracy and lineage?
We define semantic layers, enforce dbt tests, add freshness alerts, and tag every metric with owner, source, and transformation steps. Automated validation runs on each deployment, and observability dashboards track drift so stakeholders stay confident in every chart they view.
Can business users create their own reports safely?
Yes. We deliver governed self-serve environments with role-based access, templated queries, and guardrails that prevent expensive or risky operations. Training sessions and documentation help non-technical teams explore data while keeping canonical metrics intact.
Need analytics that leaders actually use?
Let’s build Node.js-powered reporting stacks your teams can’t live without.